Tradovate’s Advanced Charting add-on can give your futures market analysis a boost with tools that help visualize market data in a powerful format .
Now with Advanced Charts in addition to Volume Profile and Bid-Ask Charts, Tradovate has added Heikin Ashi, Renko and Point and Figure Charts.
Heikin Ashi Charts
Heikin Ashi Charts allow you to see the trend of the market by eliminating some of the noise created in basic candle charts as the open, high, low and close are calculated differently. Apply the Heikin Ashi Charts across any existing or custom time frame.
Renko Charts
Renko charts only take price movement into consideration and ignore time. Configure the body and projection up/down to customize your Renko charts.
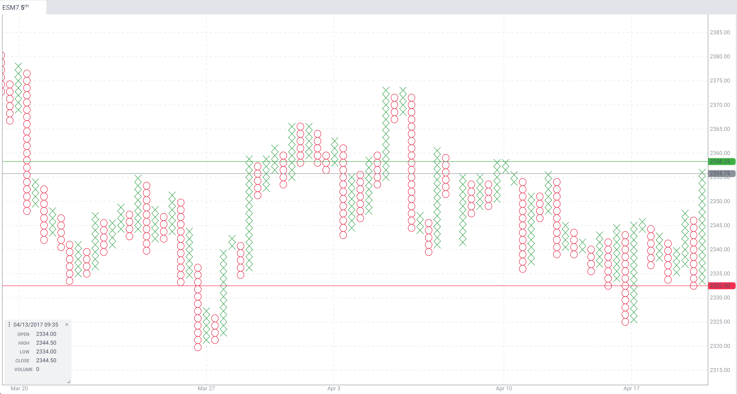
Point & Figure Charts
Point & Figure charts plots price movements for a specific price movement. The X's indicate upward movement and the O's signify downward movement. Customize the required price movement and price reversal to see longer trends.
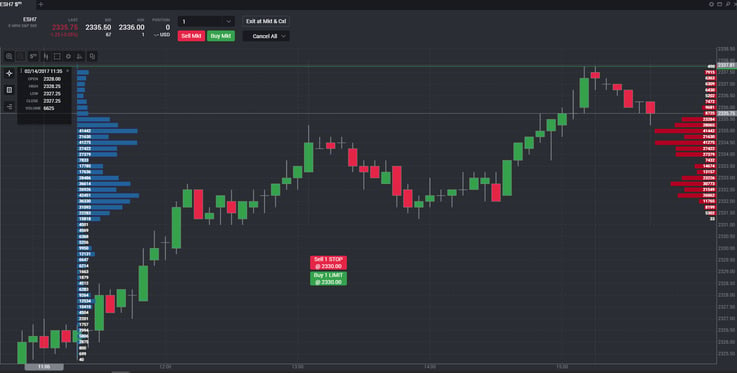
Volume Profile
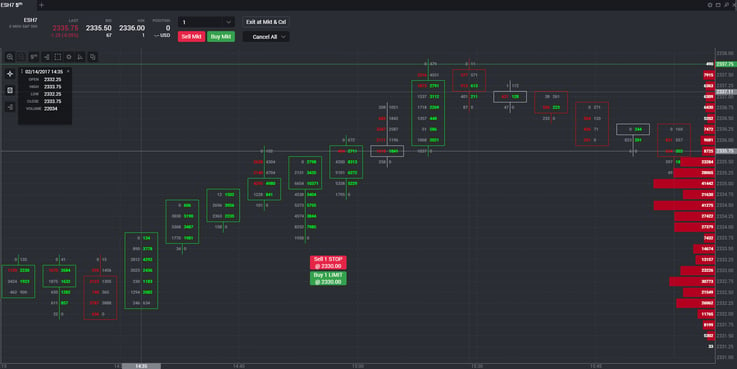
Volume profile will show how much contract volume traded at each price by displaying the market-generated data in a vertical histogram. The price distribution by volume can be further detailed with volume labels that display the exact number of contracts that trade at each price level.
Tradovate’s volume profile can be used across multiple timeframes, from tick to day, to show the volume-at-price information on your charts. The profile can be customized by drawing exactly the number of bars you want to see and multiple profiles can be applied to the same chart, giving you as much insight as you want to the volume activity in your market.
Bid-Ask Chart Type
Tradovate’s bid-ask chart type lets you look inside each candle to see how much volume traded at the bid price and ask price at each price level. The view of volume trading at the inside market can help to analyze order flow and gauge the strength of momentum, giving important perspective on who is winning the battle between buyers and sellers.
The bid-ask chart type can be used in conjunction with volume profile to provide greater detail into the dynamics of the market and help determine price rotations.