

Fully Utilizing the Tradovate Custom Indicators Graphics Module
For the last few months I’ve been hard at work mastering all of the ins-and-outs of our newest custom indicators feature, the Graphics Module. This module opens up a whole new world of possibilities when it comes to developing your own indicators — the sky is the limit! We now offer the power to draw arbitrary shapes, lines, and text to a chart using a simple but flexible coordinate system.
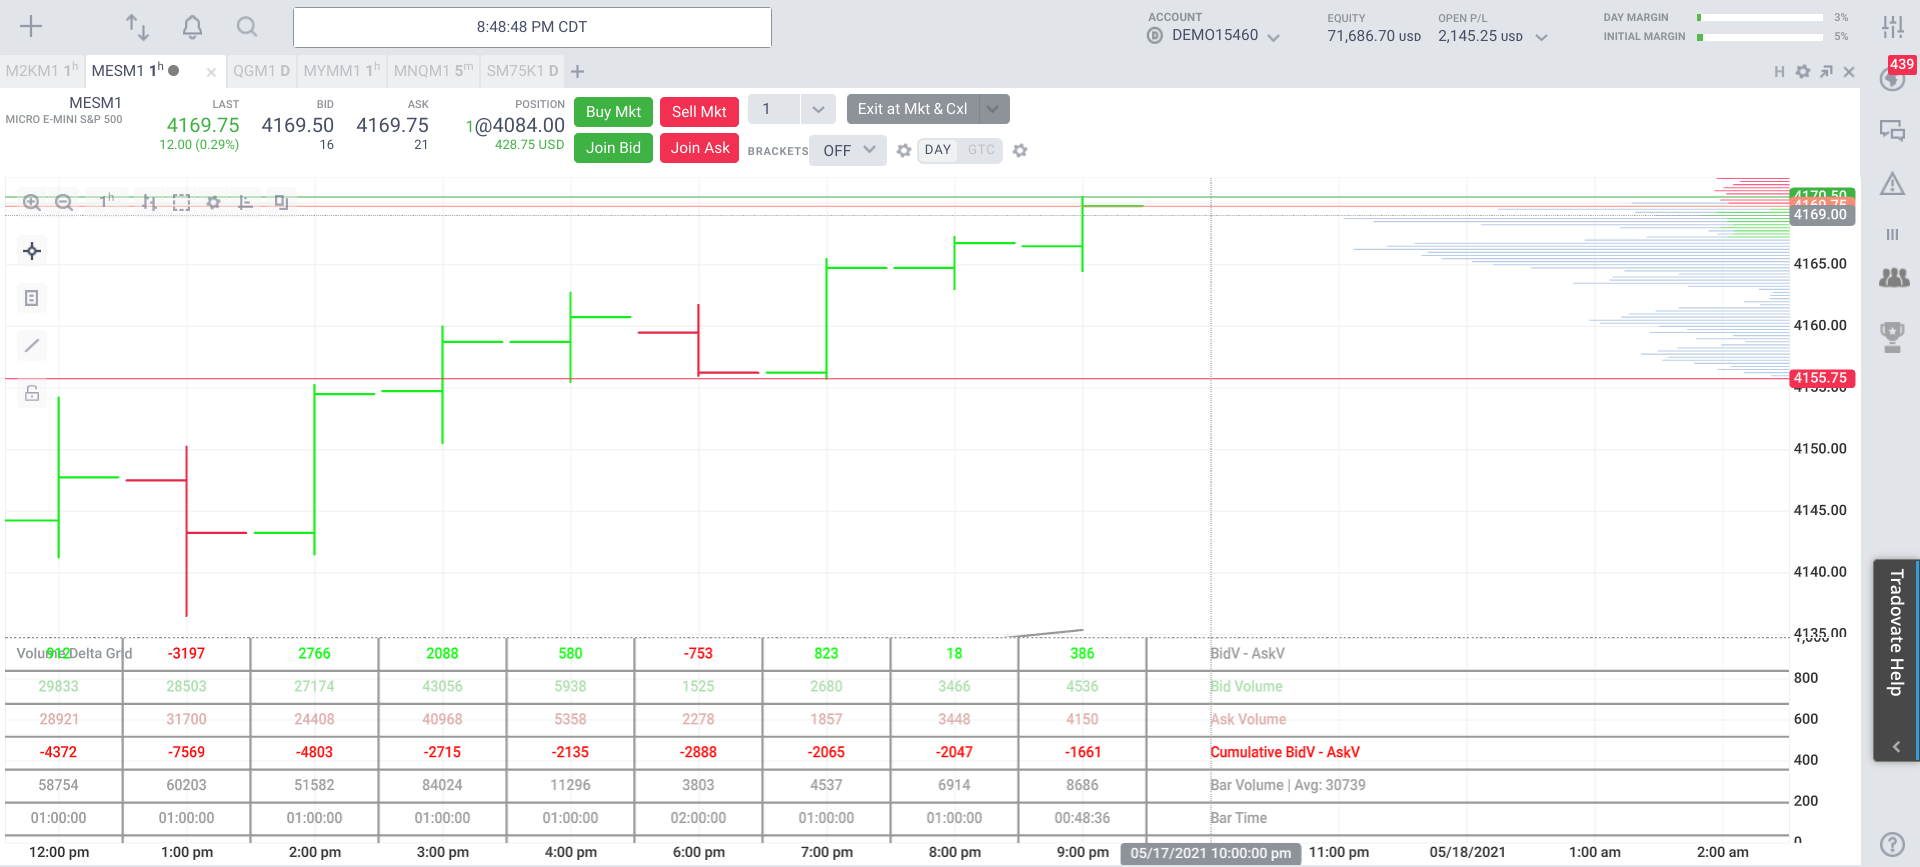
Today I’d like to offer an exclusive behind-the-scenes look at how I built Tradovate’s Volume Delta Grid indicator. This indicator utilizes many of the new Graphics module features, so if you’re interested in learning about them (or about creating custom indicators in general) this is a great place to start.
Structure Of An Indicator
Although this is a rather advanced indicator, we will start with the basics. An indicator is not just the calculator code you write, but a definition for how the Trader application should treat the entire indicator module you create. The structure of custom indicator code is designed so that if you know JavaScript, you’ll be right at home. This is evident in the module.exports portion of all indicator code.
I like to think of an indicator as the composition of three domains — the Calculator class, the helper functions I refer to as tools, and the export object. Each domain comes together as a part of the whole indicator.
…an indicator [is] the composition of three domains — the Calculator class, the helper functions I refer to as tools, and the export object.
The Calculator
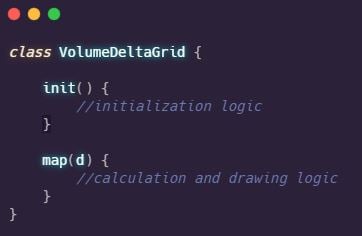
The Calculator is the main event. It is what we typically think of as the indicator itself. However, the Calculator class is actually only one part of the indicator — the part that contains all of our drawing logic. For the Volume Delta Grid, this is how we can define our calculator:
The Calculator class has two primary functions.
init— this is called when the indicator is first instantiated. This is where we should initialize tools we’re composing to make this indicator.map— the calculation logic. This is called for every bar rendered, with a few exceptions. We’ll discuss those later.
The most operative part is the
mapfunction. It takes one parameter, which we usually calldfor data.dis anInputEntityobject and obeys the interfaces on this page. A standard indicator usesdas the typeInputEntity, but if you change theinputTypeparameter on the export object to"bar"thendwill be typeBarInputEntity.
The calculator class has another function called
filter, but that is beyond the scope of this article. The Calculator class is documented here.