

As you analyze TPO Profile Charts there are some important things to note that you can use for trading throughout the day, but you need to ensure you understand the bigger picture first. You should have a view of what the market is trying to do. And is it doing a good job of it?
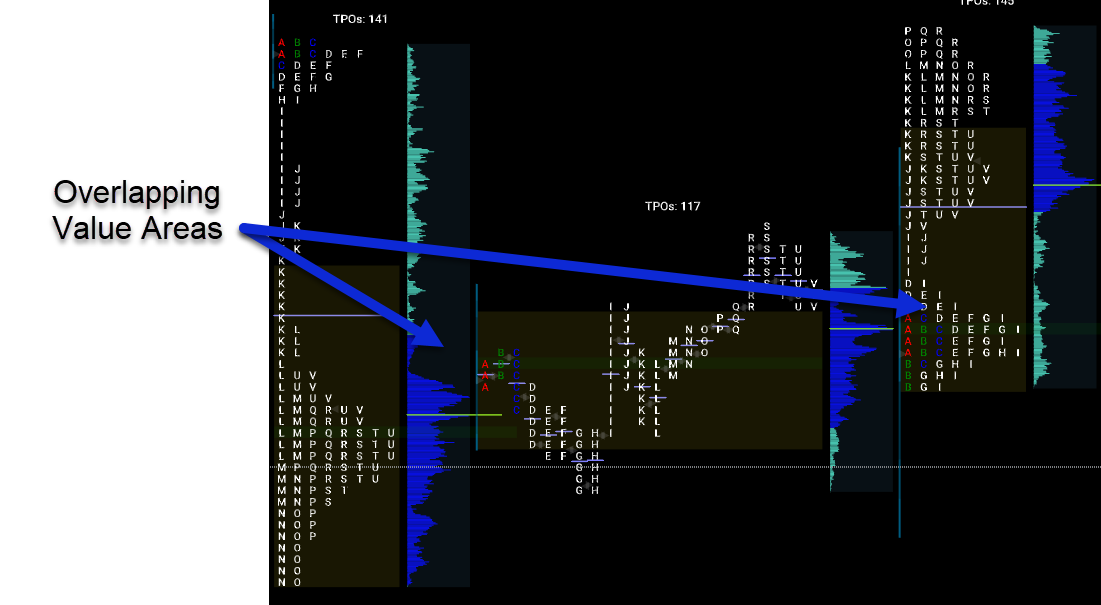
As the value area changes throughout the day, as time builds, as price trades, as volume is occurring, as the day moves on, it gets set. One way traders will use this, is to sell around the high of the value area and buy at the lower of the value area on a day where the market's rotating.

When values are higher it tends to favor the long side and when it's lower, it favors the short side. These aren't guaranteed rules but it can provide you a piece of analysis to help you build your trading strategy. These can be a tool to help position you on the right side of the market so that you're not constantly fighting against the market.
One of the most important things as a trader is risk management and you should consider your targets when placing your orders. One strategy is taking profits at Halfback for part of your position. But remember, this value area changes throughout the day, so it's one thing to look back at it and see where it was and how the market rotated, but as the market's developing and changing, the value area will change. The Value Area represents 70% of the day's activity, so you need to watch it and get a feel for how it behaves before you start applying any trading setup.
So, you can understand, Halfback is a 50% retracement, which is the range from high - low divided by two. It is an important level, a lot of times you'll see the market pullback to it or you can at least use it as a target to take some profit from a position.
Want to Learn More About TPO Profile Charts?
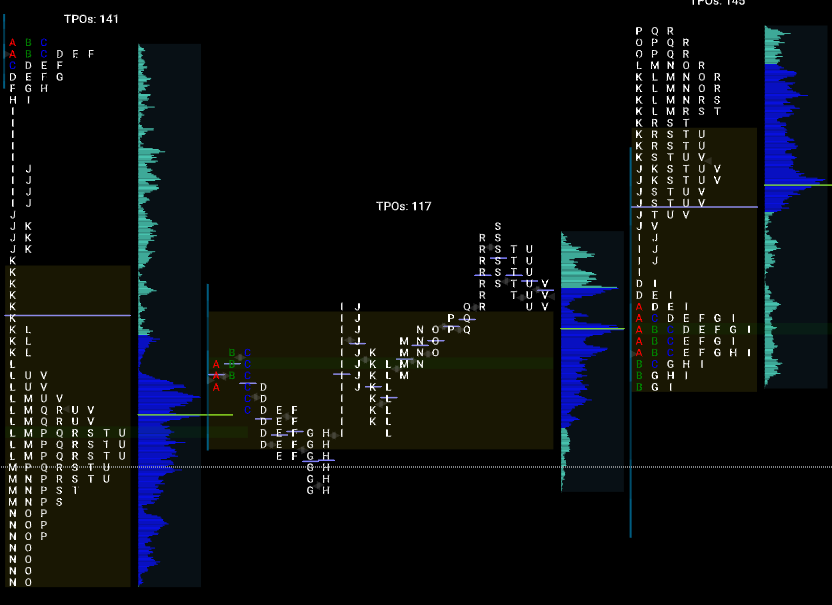
Discover how futures traders use TPO Profile charts to identify trading opportunities. TPO charts allow the user to analyze the amount of trading activity, based on time for each level the market traded at, for any given period of time. This allows you to easily see the areas where the market is trading most of the time and helps you analyze price, volume, and time in a single chart.
Find Trading Opportunities Using TPO Profile Charts