

“Price advertises, Time regulates and Volume confirms or rejects opportunities” Quote - Jim Dalton
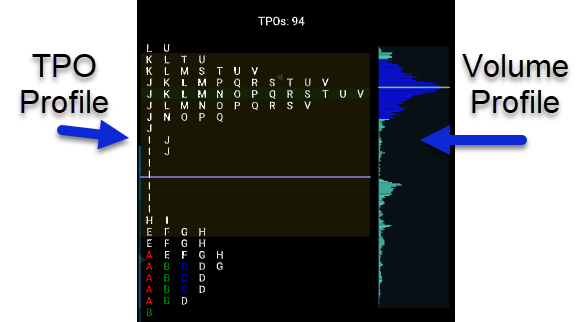
Next to the TPO Profile is a Volume Profile and that's something you may or may not be familiar with. Here we have it set side by side and we do that for contrast so we can see volume as well as TPO profile. The one with letters is the TPO Profile and that is time-based, whereas the other profile is the volume profile and that is built based on how much volume is trading at each price.
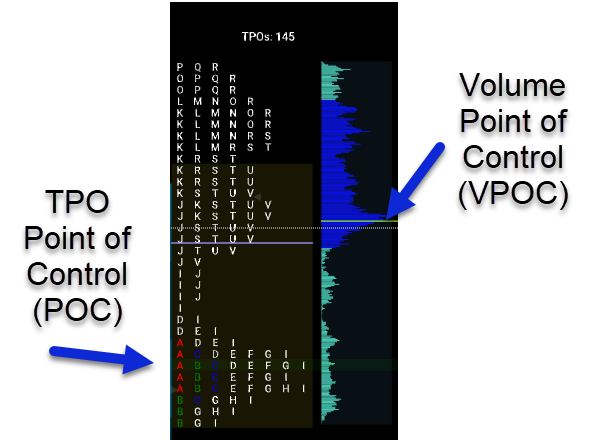
An important thing to look at is the Volume Point of Control (VPOC). Volume point of control is where the most volume occurred and oftentimes, they will line up with the Time Point of Control (TPOC) on the chart, but they don't have to.
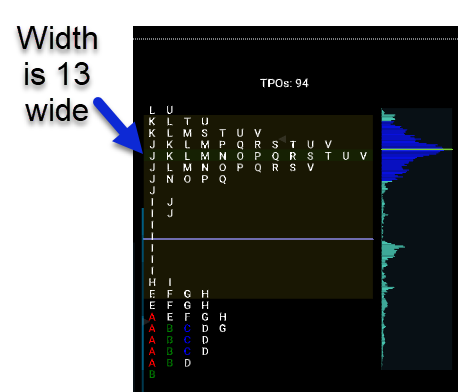
Another metric traders look at is the width of TPOC. How wide is that POC? The wider it is, the more the market is settled at those prices and more likely just to stay around those prices as the day wears on versus breaking from them because there's so much committed at that level.
Want to Learn More About TPO Profile Charts?
Discover how futures traders use TPO Profile charts to identify trading opportunities. TPO charts allow the user to analyze the amount of trading activity, based on time for each level the market traded at, for any given period of time. This allows you to easily see the areas where the market is trading most of the time and helps you analyze price, volume, and time in a single chart.
Find Trading Opportunities Using TPO Profile Charts
Identify Trade Setups, Profit Targets & Trading Strategies Using TPO Profile Charts